22 Years of Price Changes
Source: American Enterprise Institute Published: January 2020

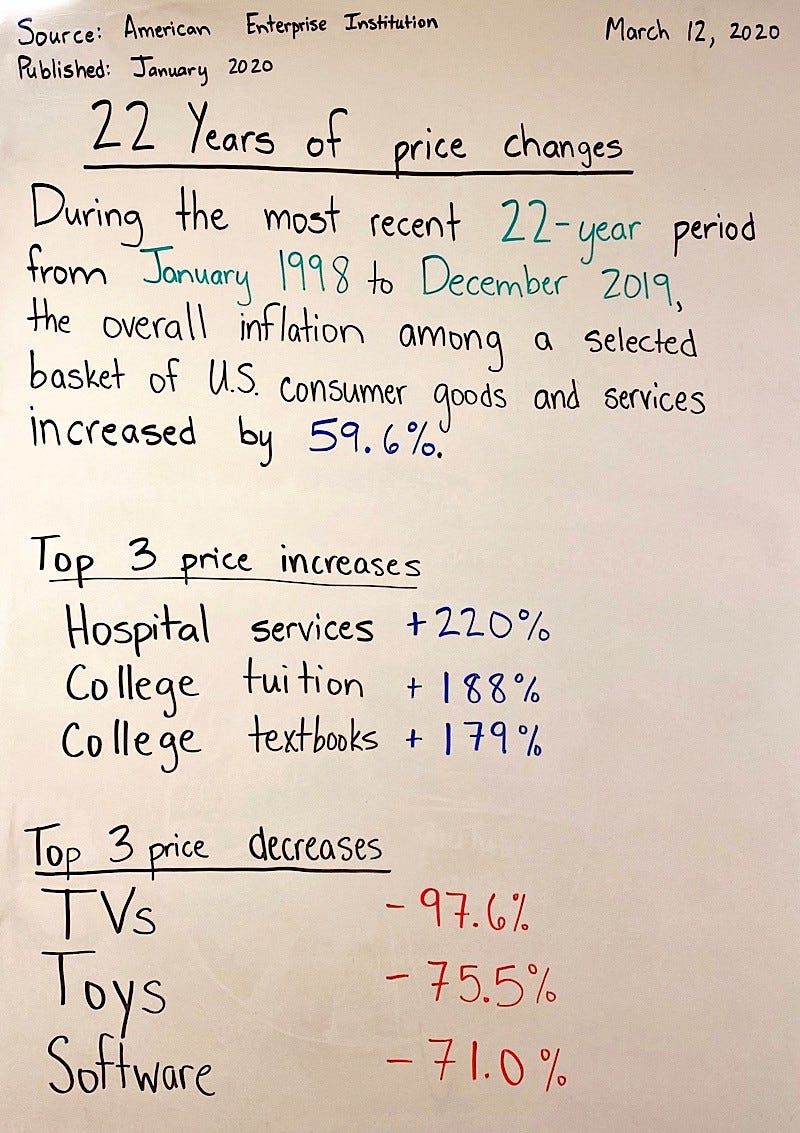
Source: American Enterprise Institute
Published: January 2020
22 Years of Price Changes
Circulated: March 12, 2020
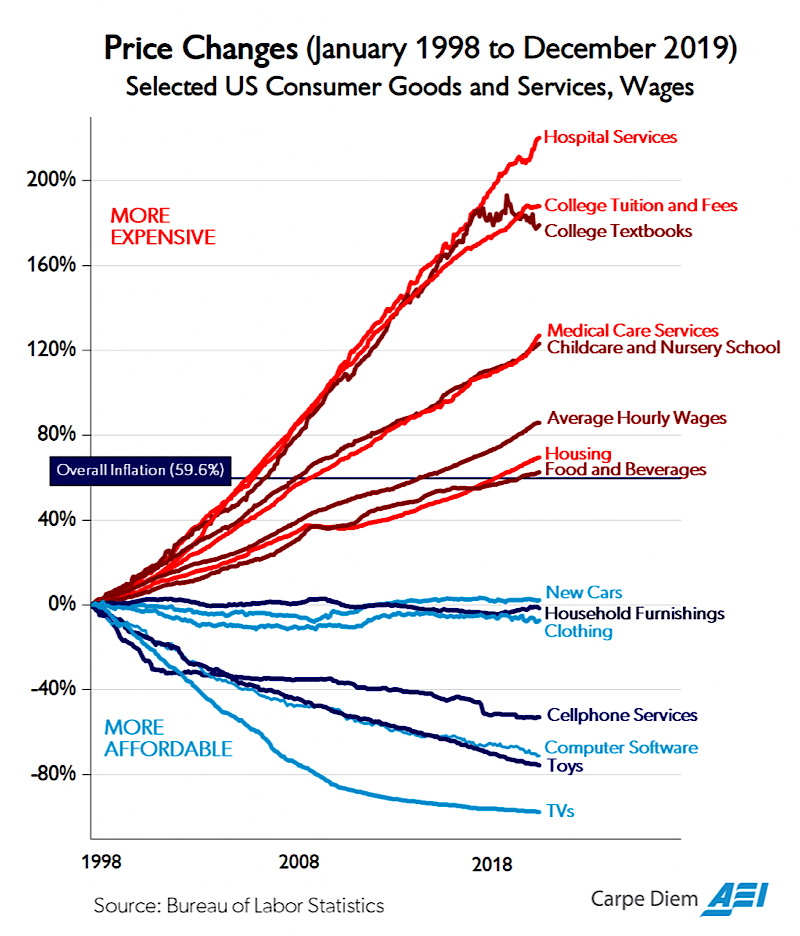
During the most recent 22-year period from January 1998 to December 2019, the overall inflation among a selected basket of US consumer goods and services increased by 59.6%. The chart displays the relative price increases over for 14 selected consumer goods and services, and for average hourly earnings (wages).
Hospital services +220%
College tuition +188%
College textbooks +179%
TVs –97.6%
Toys –75.5%
Software –71.0%