![](https://substackcdn.com/image/fetch/w_1456,c_limit,f_auto,q_auto:good,fl_progressive:steep/https%3A%2F%2Fbucketeer-e05bbc84-baa3-437e-9518-adb32be77984.s3.amazonaws.com%2Fpublic%2Fimages%2Fbef65447-f1a2-4dfb-8ae4-639c6c2117d9_800x1322.jpeg)
Source: Our World in Data
Published: October 2019
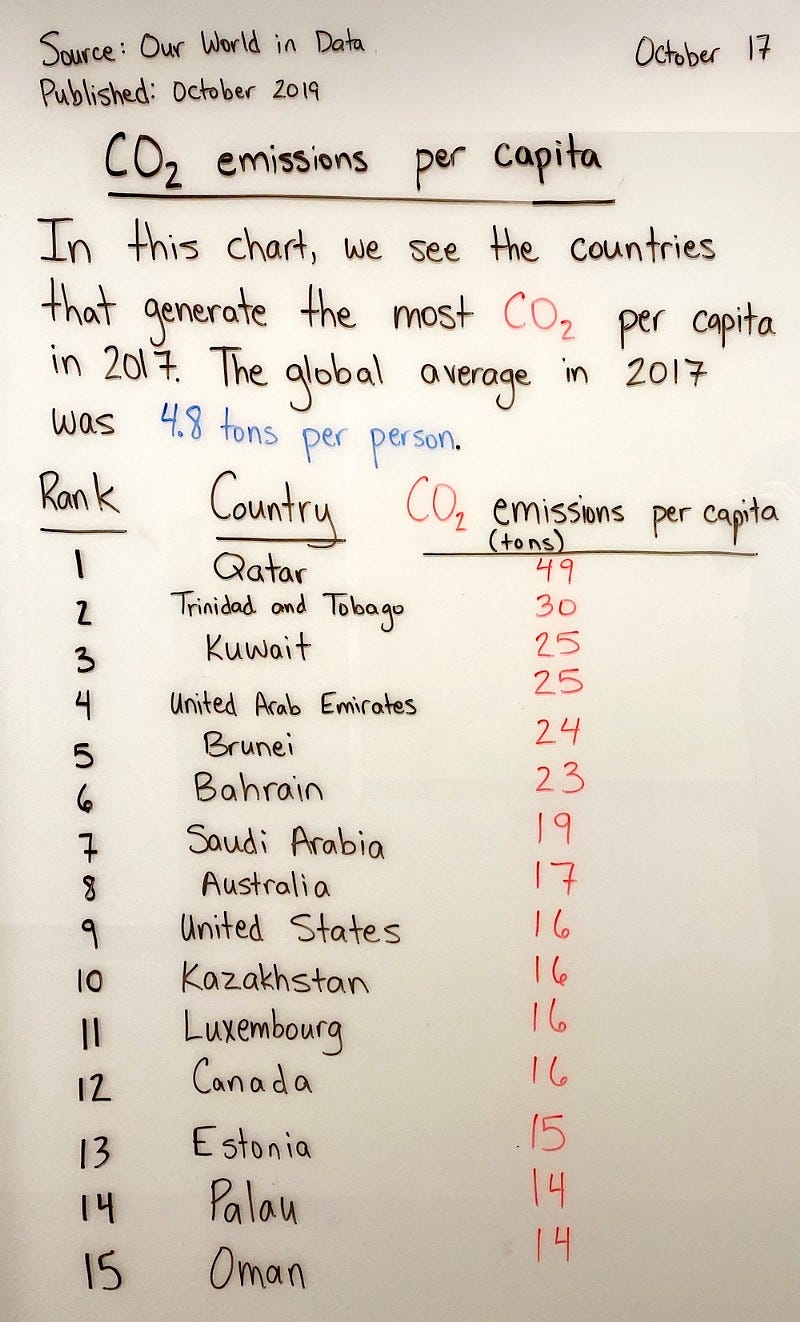
CO₂ Emissions Per Capita
Circulated: October 17, 2019
In this chart, we see the countries that generated the most CO₂ per capita in 2017. The global average in 2017 was 4.8 tons per person.
![](https://substackcdn.com/image/fetch/w_1456,c_limit,f_auto,q_auto:good,fl_progressive:steep/https%3A%2F%2Fbucketeer-e05bbc84-baa3-437e-9518-adb32be77984.s3.amazonaws.com%2Fpublic%2Fimages%2Fa82c2c98-269e-48e9-9cbb-e633248c2015_545x376.png)
Source: Our World in Data
Published: October 2019
Circulated: October 17, 2019
In this chart, we see the countries that generated the most CO₂ per capita in 2017. The global average in 2017 was 4.8 tons per person.
No posts