
December 1: Fishbone diagram
This diagram helps management identify what caused a problem to occur in order to avoid the same problem in the future.

Source: Investopedia
Published: March 2020
Fishbone diagram
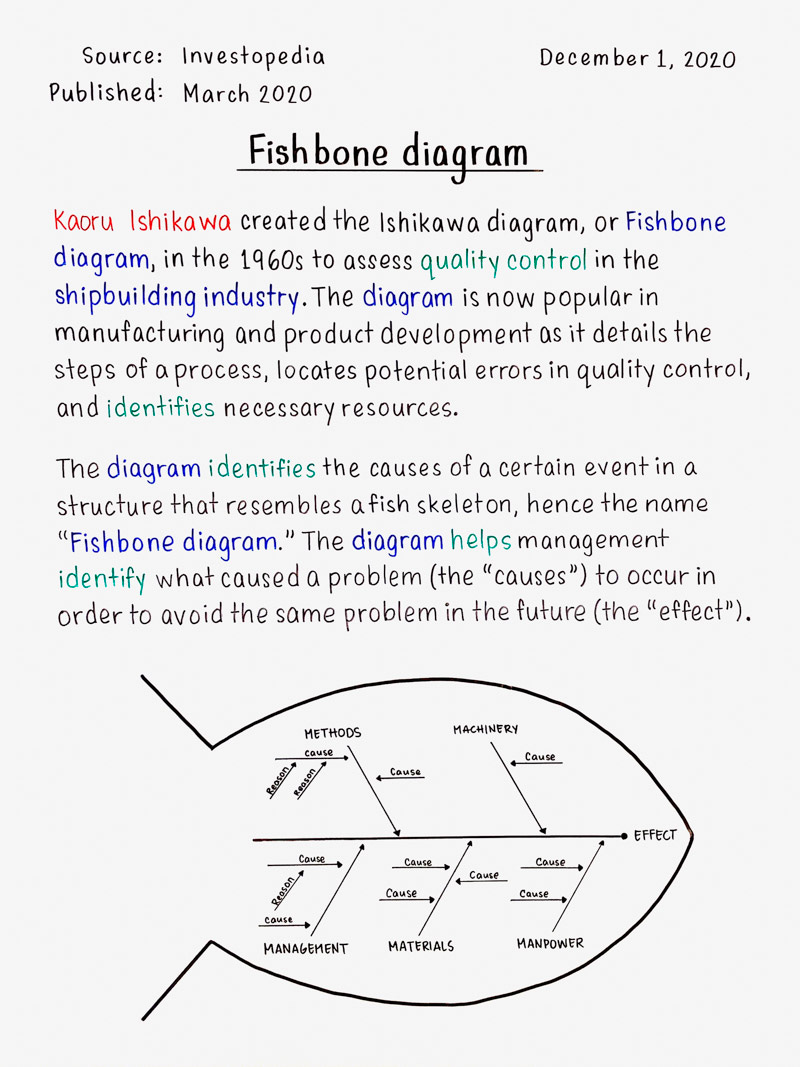
Kaoru Ishikawa created the Ishikawa diagram, or Fishbone diagram, in the 1960s to assess quality control in the shipbuilding industry. The diagram is now popular in manufacturing and product development as it details the steps of a process, locates potential errors in quality control, and identifies necessary resources.
The diagram identifies the causes of a certain event in a structure that resembles a fish skeleton, hence the name “Fishbone diagram.” The diagram helps management identify what caused a problem (the “causes”) to occur in order to avoid the same problem in the future (the “effect”).

------------
Did you appreciate the fact today?