
May 20: Digital Consumer Trends
Source: PricewaterhouseCoopers (PWC) Published: May 2019

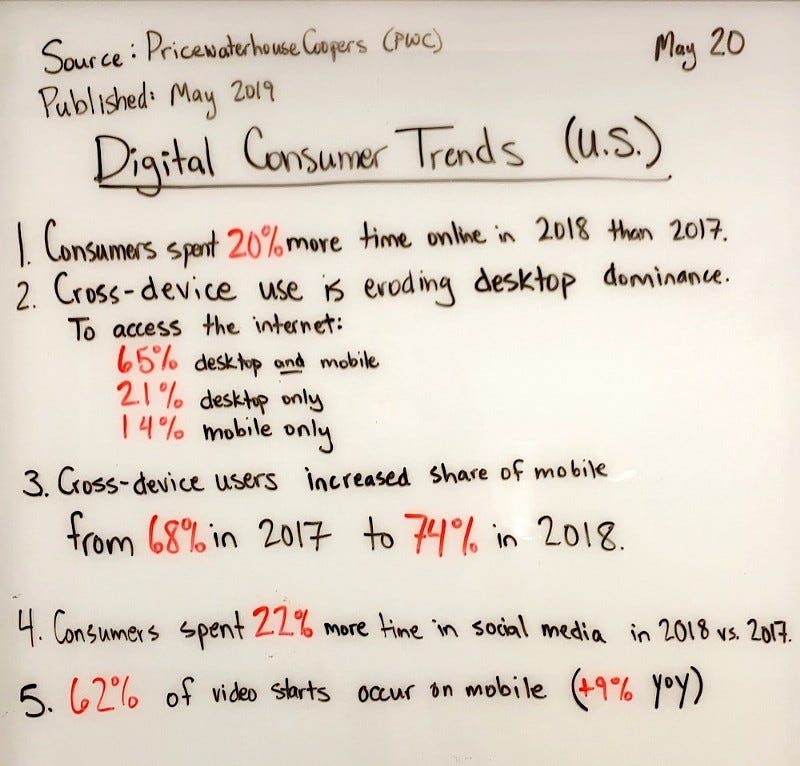
Source: PricewaterhouseCoopers (PWC)
Published: May 2019
U.S. Digital Consumer Trends
Circulated: May 20, 2019
Consumers spent 20% more time online in 2018 than 2017
Cross-device erodes desktop dominance. To access the internet, 65% of consumers will use desktop andmobile, 21% desktop only and 14% mobile only
Mobile increased share of time spent online to 74% in 2018 vs. 68% in 2017.
Consumers spent 22% more time on social media in 2018 vs 2017.
Video is made for mobile. 62% of video starts occur on a mobile device (+9% YoY)