Fact of the Day 1

Share this post

September 28: Price changes in the US from 2000 to 2021

www.factoftheday1.com

September 28: Price changes in the US from 2000 to 2021

Overall inflation is 60% over the last 21.5-year period for select consumer goods and services.

Danny Sheridan
Sep 28, 2021
20
2
Share this post

September 28: Price changes in the US from 2000 to 2021

www.factoftheday1.com

Suggest a topic for a future fact.

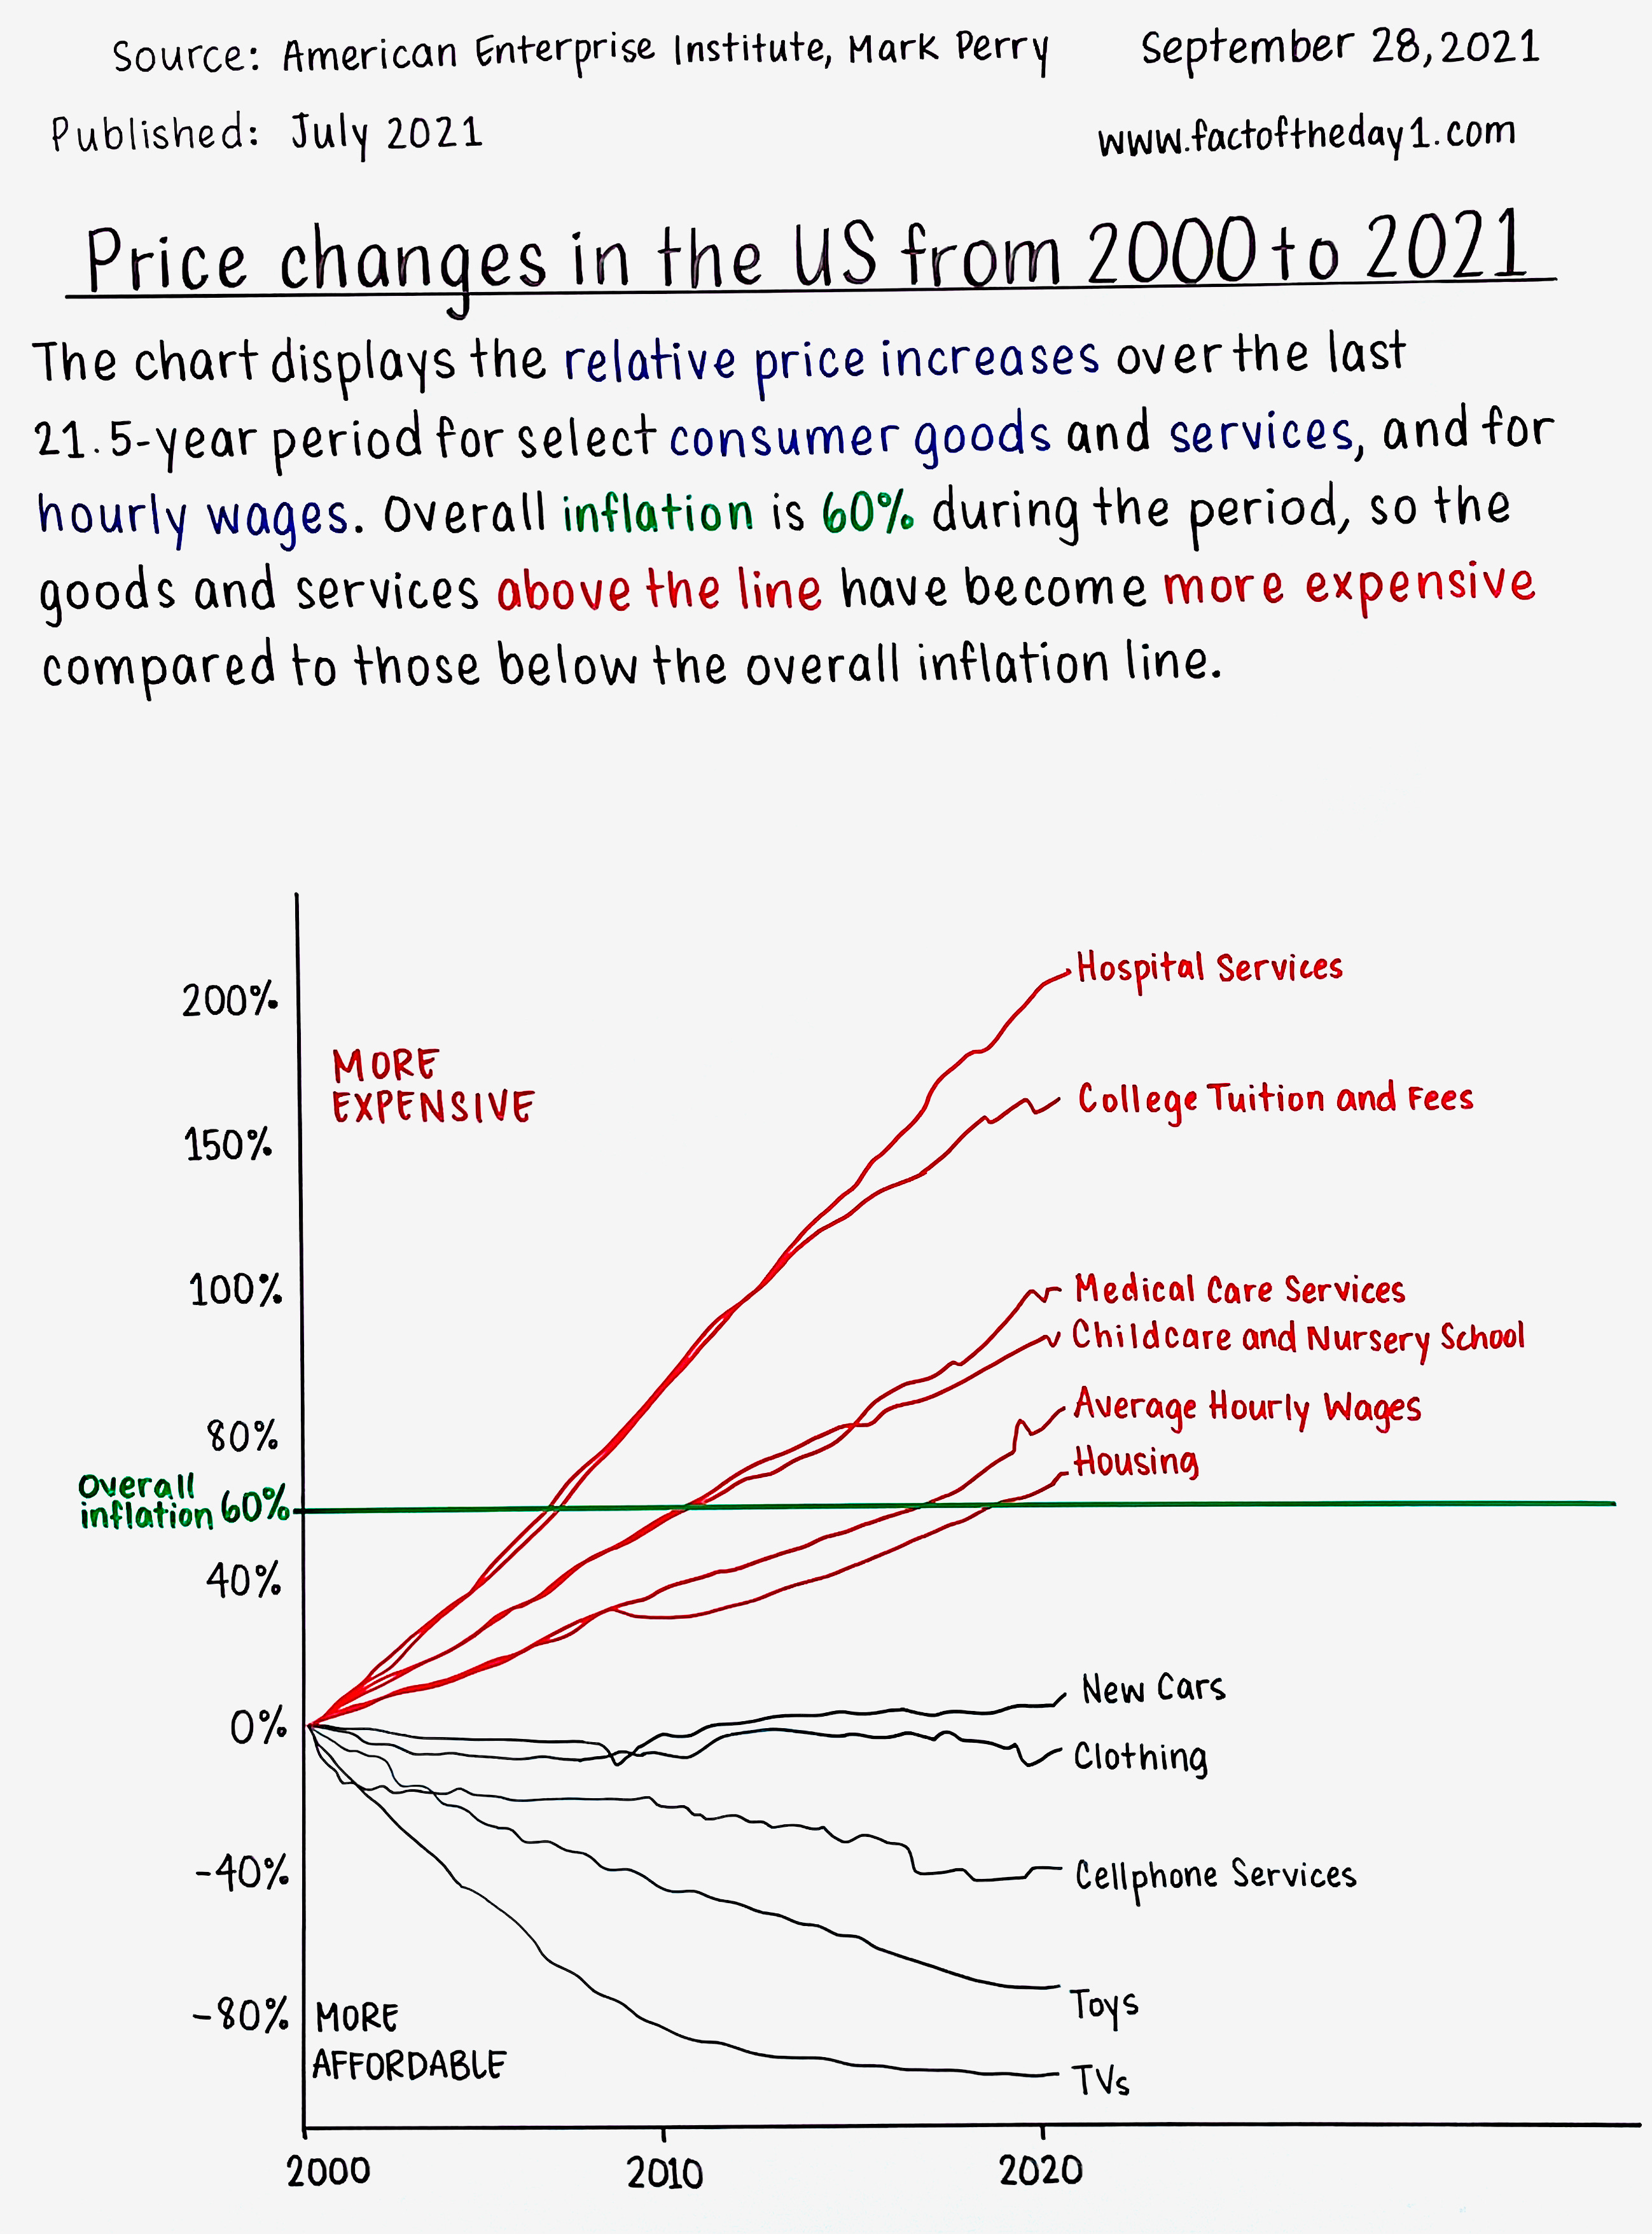
Source: American Enterprise Institute, Mark Perry
Published: July 2021

Price changes in the US from 2000 to 2021

The chart displays the relative price increases over the last 21.5-year period for select consumer goods and services, and for hourly wages. Overall inflation is 60% during the period, so the goods and services above the line have become more expensive compared to those below the overall inflation line.

Leave a comment

2
Share this post

September 28: Price changes in the US from 2000 to 2021

www.factoftheday1.com
2 Comments
Eli Kur
Sep 29, 2021

Good stuff. Thank you!

Expand full comment
ReplyCollapse
Harpreet Singh
Sep 28, 2021

would be interesting to see a similar chart for Canada

Expand full comment
ReplyCollapse
TopNewCommunity

No posts

Ready for more?

© 2023 Fact of the Day 1
Privacy ∙ Terms ∙ Collection notice
Start WritingGet the app
Substack is the home for great writing