Fact of the Day 1

Share this post
Using a Gantt Chart to Manage Projects
www.factoftheday1.com

Using a Gantt Chart to Manage Projects

Source: Gantt.com Published: February 2010

Danny Sheridan
Jan 23, 2020
Comment
Share

Source: Gantt.com
Published: February 2010

Using a Gantt Chart to Manage Projects

Circulated: October 28, 2019

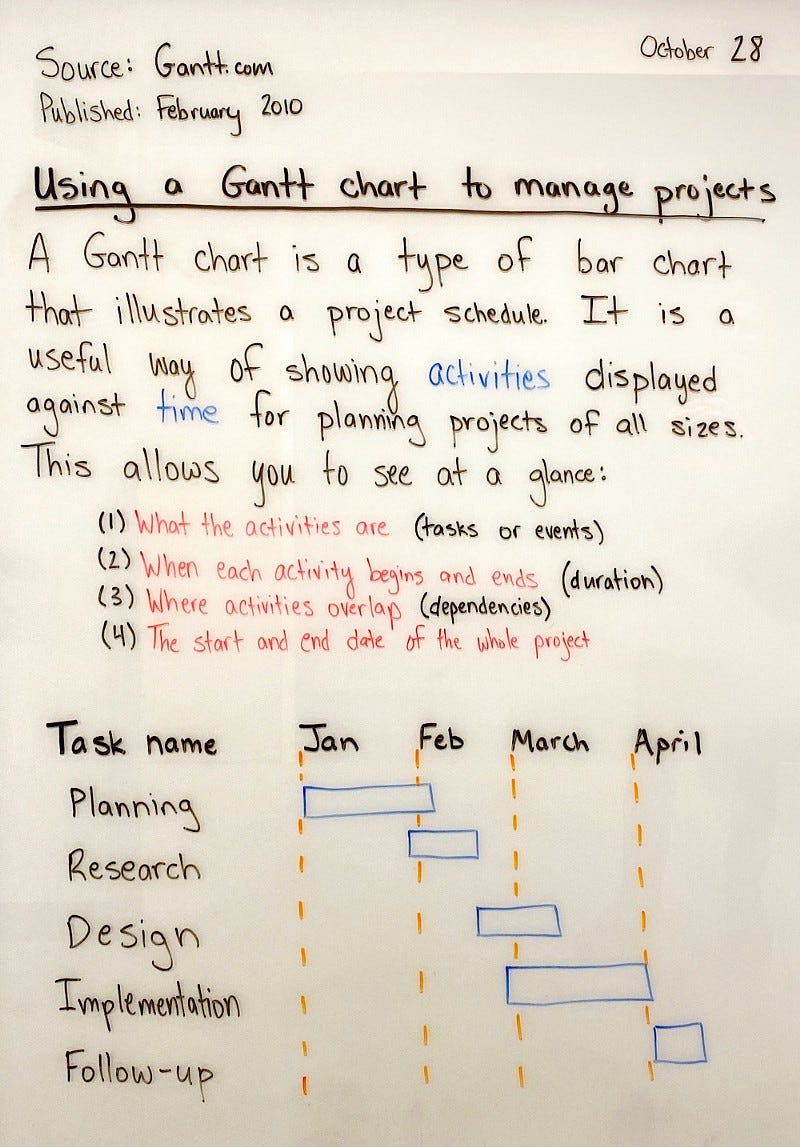
A Gantt chart is a type of bar chart that illustrates a project schedule. It is a useful way of showing activities displayed against time for planning projects of all sizes. This allows you to see at a glance:

  1. What the activities are (tasks or events).

  2. When each activity begins and ends (duration).

  3. Where activities overlap (dependencies).

  4. The start and end date of the whole project.

CommentComment
ShareShare

Create your profile

0 subscriptions will be displayed on your profile (edit)

Skip for now

Only paid subscribers can comment on this post

Already a paid subscriber? Sign in

Check your email

For your security, we need to re-authenticate you.

Click the link we sent to , or click here to sign in.

TopNewCommunity

No posts

Ready for more?

© 2022 Fact of the Day 1
Privacy ∙ Terms ∙ Collection notice
Publish on Substack Get the app
Substack is the home for great writing